Development of a production statistic for concrete plants.
Production statistic
Development of a production statistic for concrete plants.
The company "Hess Group GmbH" was looking for a new system to capture the production data of their concrete block machines. The following criteria had to be satisfied by the system:
the system should be independent of the visualization system
no license costs
the data should be stored in a Microsoft SQL Server database
the data should be available from different locations
the system should work without maintenance
The realization
The data is collected with the database interface IBU-DBI.
The controllers and the database server communicate directly. The independence of the machine visualization is guaranteed.
The IBU-WebVisu is used as visualization system for the production statistics. This is a framework that is programmed in ASP.NET. It provides user control, language switching, adjusted screen resolution and other important functions for web applications in intranet areas. The data can be viewed anywhere, also on mobile devices.
The following reports are provided:
graphical overview report with all key information for a selected data areas
graphical comparison overview report with all key information for two selected data areas
tabular shift analysis with all the information for a selected data areas
tabular charge analysis with all the information for a selected data areas
The following data is collected:
number of 1. quality, 2. quality and waste
number of stacked pallets
the current state of the plant is logged at any time (production, downtimes, waiting times, ...)
assignment of the product name, item number and order to any charge
assignment of operators to each shift
Additional functions:
automatic shift management for three-shift operation
manual shift management with an assignment for the operator
automatic charge management for product change
manual charge management
automatic database maintenance with a task planner
Archiving functions for older data
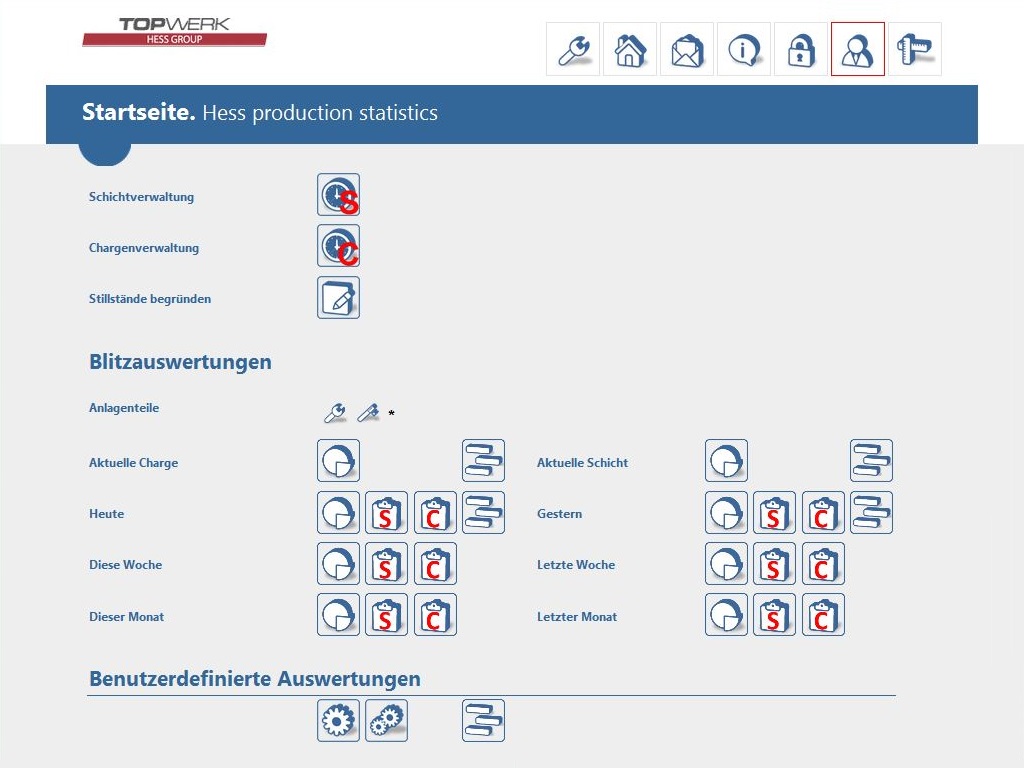
Homepage of the web application with different quick reports.
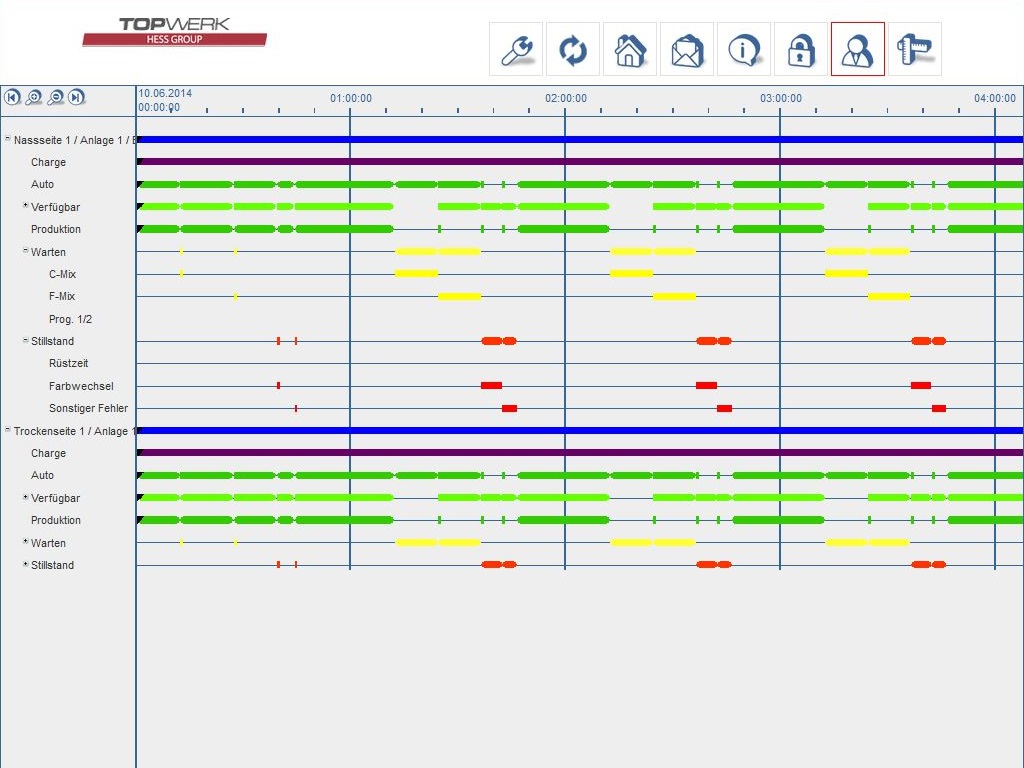
The Gantt chart shows the state of the systems in chronological order.
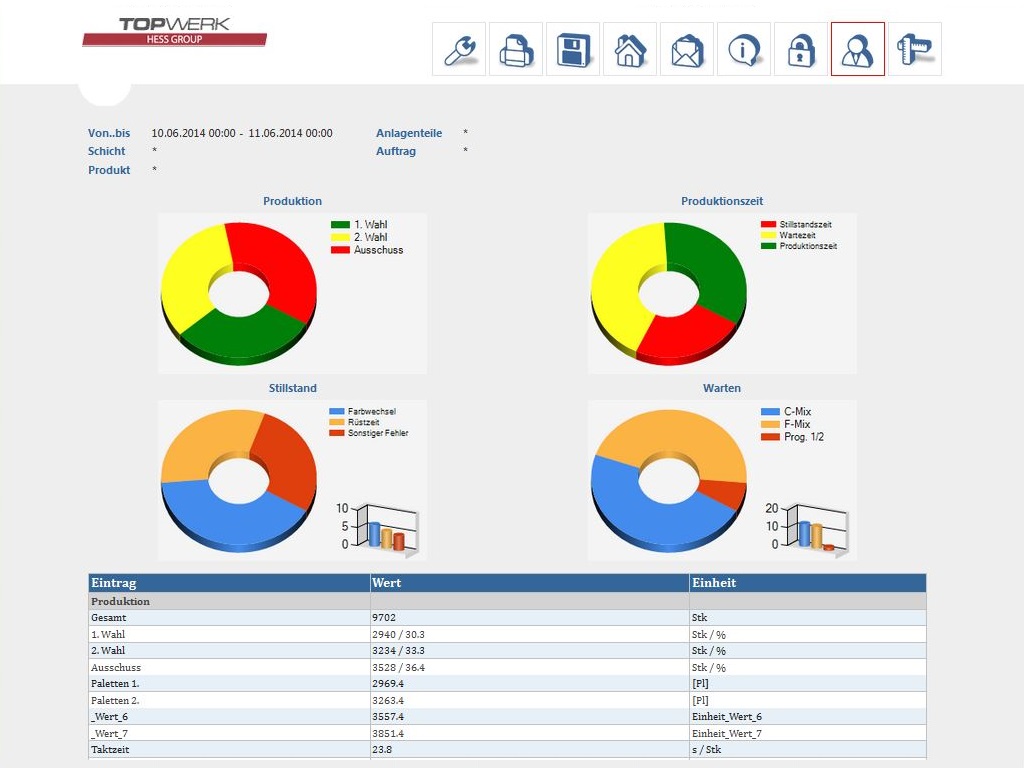
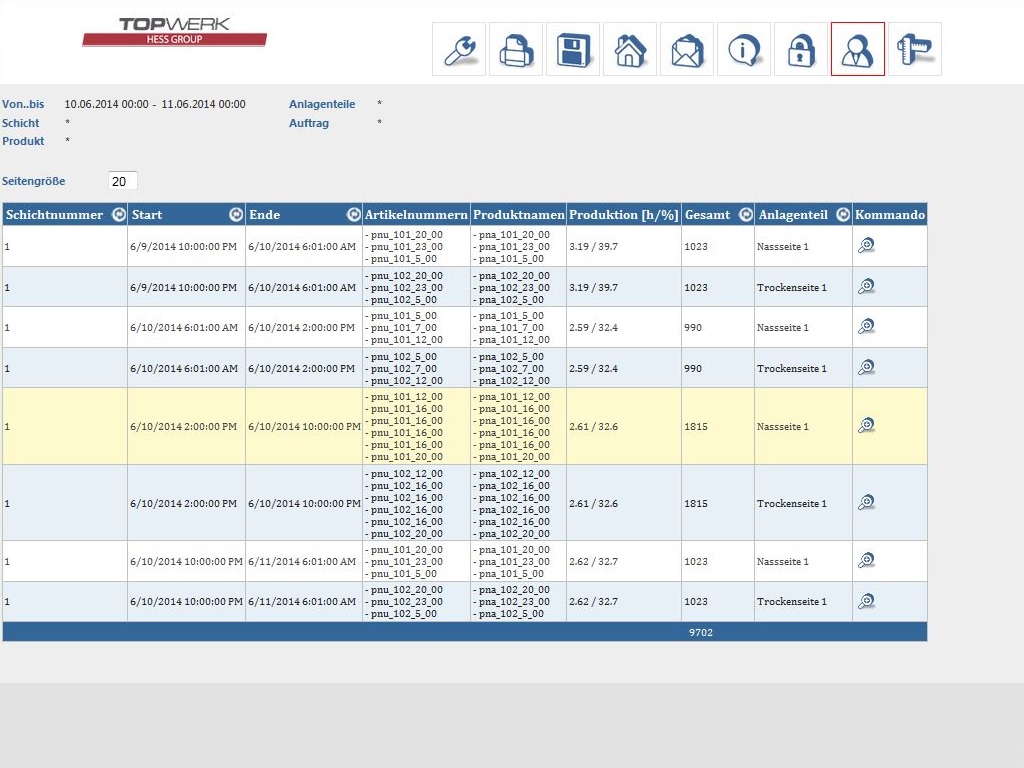
The overview report shows the most important data for the filter previously set.
The charge analysis displays data of each charge. The columns are configurable.
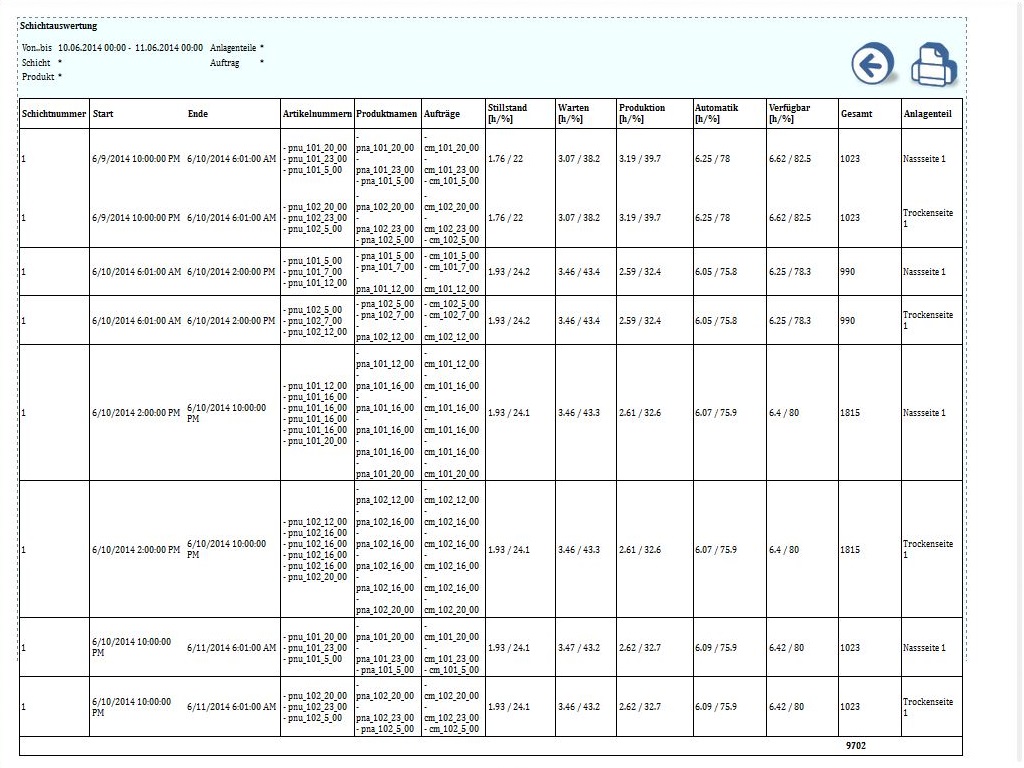
A charge analysis as a print preview. The data are reduced to a printable format.
Parts of the database model of the production statistic as Entity-Relationship Model.